Research Article | | Peer-Reviewed

Assessment of Genetic Variability and Character Association of Watermelon (Citrullus lanatus) varieties Using Agromorphological Characters

Received: 29 May 2025     Accepted: 16 June 2025     Published: 26 February 2026
Views:       Downloads:
Abstract

Understanding genetic diversity and germplasm classification through agro-morphological characterization is fundamental in order to provide information for genetic resources conservation and breeding programs. The overall objective of this study was to assess the genetic variability of watermelon varieties cultivated in Cameroon. Five watermelon (Citrullus lanatus) genotypes were evaluated for genetic variability, heritability, and genetic advance for yield and its contributing characters in watermelon during 2017. Analysis of variance showed significant variation for all the studied characters, indicating the presence of sufficient variability in the material. Germination rates of the five varieties vary from 61.11 ± 5.82 to 90.71 ± 1.12% for Sugar Baby and Kaolack. Emergence time ranges from 7.03 ± 0.87 (Kaolack) to 8.73 ± 1.03 (Koloss), while flowering time varies from 28.27 ± 0.45 (Crimson Sweet) to 36.24 ± 0.32 (Sugar Baby) days. The number of fruits (fruit count) show that Kaolack has the highest number of fruits per plant (3.55 ± 0.89), followed by Crimson Sweet (3.32 ± 0.5) while Koloss presents the lowest number of fruits per plant (2.12 ± 0.27). Of the 45 correlations performed, 26 were negative and 19 were positive. All negative correlations were not significant at the 5% level, while 5 positive correlations were significant. This result shows that length of fruit is correlated with weight of fruit (0.99) and weight of one hundred seeds (0.88). Moreover, the correlation between these two fruit characteristics (weight of fruit and length of fruit) appeared strong and positive (0.92). The phenotypic coefficient of variation ranged from 20.35 to 201.49 for the seed shape and weight of fruit parameters, respectively, while the genotypic coefficient of variation ranged from 17.72 to 198.65 for the same traits, respectively. All the traits studied showed that the phenotypic variance was higher than the genotypic variance. High broad-sense heritability coupled with moderate-high genetic advance was recorded for weight of one hundred seeds (11.63), while high broad-sense heritability associated with low genetic advance values was obtained for seed shape (0.21), seedling emergence time (5.89), and number of fruits per plant (6.43). Only the first two axes of the principal component analysis were taken into account because they explained about 92.31% of the variation observed in the varieties. The main parameters associated with these two axes were weight of fruit, length of fruit, flowering time, weight of one hundred seeds and life cycle. Based on the variation, 5 genotypes were grouped into three classes using the K-means classification. Further studies involving biochemical and molecular markers are recommended for deeper characterization.

Published in International Journal of Genetics and Genomics (Volume 14, Issue 1)
DOI 10.11648/j.ijgg.20261401.12
Page(s) 14-24
Creative Commons

This is an Open Access article, distributed under the terms of the Creative Commons Attribution 4.0 International License (http://creativecommons.org/licenses/by/4.0/), which permits unrestricted use, distribution and reproduction in any medium or format, provided the original work is properly cited.

Copyright

Copyright © The Author(s), 2026. Published by Science Publishing Group

Keywords

Citrullus lanatus, Agromorphological Traits, Genetic Variability, Genetic Advance

1. Introduction
Watermelon [Citrullus lanatus (Thunb.) Matsum & Nakai] is a fruiting vegetable belonging to the Cucurbitaceae family . It is a monoecious and/or andro-monoecious annual plant . Its fruit has a thick rind (exocarp) of variable pigmentation with a solid and sometimes striped appearance, a fleshy mesocarp, and an endocarp whose color varies from white to yellow or red . Therefore, consumption of watermelon seeds could contribute to combating protein-energy malnutrition and enhance food security . Watermelon production in Cameroon is unevenly distributed across the country, with high production in the West and North-West regions . These regions produce nearly 70%, unlike the southwest regions, such as Buea and its surroundings, which have a humid tropical climate and nutrient-rich volcanic soils with great potential for watermelon production but which are unfortunately underexploited . Its consumption has increased due to its nutritional profile and associated health benefits. Its fruit is effective in reducing cancer, cardiovascular disorders, diabetes, blood pressure, and obesity. Quantitative assessment indicates that it contains 46% calories, 20% vitamin C, and 17% vitamin A and has more lycopene than tomato . The plant has nutritional and medicinal value due to phenolic compounds and flavonoids present in the fruit and juice. The seeds are essential due to their fatty acid content. The major phytoconstituents reported include lycopene, β-carotene, cucurbitacin E, citrulline, arginine, β-ionone, citral, and ascorbic acid. Xanthophylls are also reported in some varieties . The moisture content, ash, crude fiber, ether extract, crude protein, and true protein ranged from 5.43 to 6.82, 2.78 to 3.72, 1.66 to 3.94, 55.7 to 58.7, 19.16 to 25.18, and 10.8 to 13%, respectively . Considering publications on different parts of Citrullus lanatus reported that the seed received the highest attention with 42.1%, followed by fruits at 35.5%, rind at 18.1%, and leaf at 2.5%, while the least was whole fruit at 1.7%. Mineral determinations revealed potassium to be more abundant in the rind (452.31 mg/kg) than in the seed (305.7 mg/kg) and the pulp (100.5 mg/kg), followed by calcium occurring more in the rind (292.61 mg/kg) than in the pulp (257.21 mg/kg) and seed (227.45 mg/kg). Also, different parts exhibited cardioprotective, reproductive, toxicological, hepatoprotective, neuroprotective, analgesic, and anti-inflammatory activities and anti-ulcerative efficacy due to phytochemicals, antioxidants, and proximate constituents in different parts of C. lanatus . The findings suggest that, in addition to the commonly consumed pulp, both the seeds and rind of C. lanatus are valuable sources of nutrients, phytochemicals, and antioxidants. With further evidence based research, these components may play a role in the management of certain diseases .
Indeed, limited research has been carried out in Africa on watermelon production compared with cereals and legumes . In order to conduct studies in this area, it would seem essential to study the agronomic performance of existing cultivars in genetic improvement programs. According to the study of , New technologies must be developed to accelerate breeding through improving genotyping and phenotyping methods and by increasing the available genetic diversity in breeding germplasm . The overall objective of this study was to assess the genetic variability of five watermelon varieties cultivated in Cameroon. This is expected to provide valuable information to genetic breeding programs, potentially leading to the development of higher performing varieties.
2. Materials and Methods
2.1. Experimental Site and Plant Material
The work was carried out during two agricultural seasons (2017-2018) in the locality of Eloumdeng II in the Centre Region of Cameroon. This site is located in the agroecological zone V (05°08'25'' latitude N, 10°31'22.1'' longitude E, altitude of 740 m), characterized by a bimodal rainfall, a total annual rainfall of 1836.7mm, an average temperature of 25.01°C and an average relative humidity of 75%.
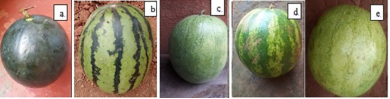
Figure 1. Fruits of the five watermelon varieties. a: Sugar baby, b: Koloss, c: Charleston gray, d: Crimson sweet, e: Kaolack.
Seeds of five watermelon varieties named Sugar Baby, Kaolack, Crimson Sweet, Charleston Gray, and Koloss (Figure 1) were obtained from a seed company (Semagri) and evaluated in the field to assess the genetic parameters associated using morphological traits in the watermelon genotypes as in .
2.2. Methods
2.2.1. Evaluation of Agro-morphological Parameters
Ten parameters selected among the descriptors of cucurbits were used in this study. Four plant characteristics, including germination rate (GR); seedling emergence time (ET); flowering time (FT) and life cycle (LC). Four fruit traits, integrating number of fruits per plant (NF); length (LF), diameter (DF) and weight (WF) of mature fruits;
Two seed data, namely the shape (SS) and the weight of one hundred seeds (WS).
To determine GR (in%) and ET, three batches of 50 seeds of each variety were randomly selected and planted at a depth of 2 cm on the experimental plot. A seed was classified as germinated when the cotyledons appeared above ground level, with the hypocotyl still bent downwards. The ET is the number of days after which both cotyledons have completely developed into leaves. FT, which is the number of days between the day of sowing and the first flowering, and LC, which is the number of days between sowing and fruit ripening, were also evaluated. These three-time parameters were expressed in days after sowing (DAS). For each variety, fruit weight (in kg), diameter, and length (in cm) were determined from 30 randomly selected fruits from the harvest.
For the measurement of seed shape, four batches of 25 seeds per variety were made up. Their shape was determined from the ratio of width (distance between the lateral edges of the seed) to height (distance from the base of the seed to the top). This ratio, which expresses the degree of circularity of the seed, is equal to unity for round seeds and closer to zero for the more elongated seeds. The measurements were made individually on each seed by placing it on graph paper Three shapes were determined according to the value of the ratio between the width (L) and the height (H) as round (L/H = 1), wide (L/H > 1) or elongated (L/H < 1) .
The weight (in g) of 100 seeds was determined by making up five batches of 100 seeds for each variety, each batch having been weighed using a 0.01g precision balance of the Sartorius brand.
2.2.2. Experimental Design and Data Analysis
The experimental set-up consisted of randomized complete blocks (RCB) with three replications. Each elementary plot includes 10 plants, spaced by 0.8 m between plants and 3.5 m between rows. This density takes into account the rampant nature of the species, which quickly covers the ground .
The data obtained were subjected to analysis of variance (ANOVA) using R software (version 3.5.1) for multiple comparisons of the means, and their classification was compared using the Least Significant Difference (LSD) at 5% threshold.
The analysis of the genetic parameters covered the environmental variance (VE), the genotypic variance (VG), the phenotypic variance (VP), the environmental coefficients of variation (ECV), the genotypic coefficients of variation (GCV), the phenotypic coefficients of variation (PCV), broad-sense heritability, the genetic gain (GA), and the genetic gain as a percentage of the mean . These genetic parameters (Table 1) were estimated based on the formula described by .
Table 1. Formulas for the various estimated genetic parameters and meaning of terms.

Parameters

Formulas

Meaning of terms

Phenotypic variance (PV)

PV = VG + (MSE/r) = MSG/r

MSE: mean square of genotypes

Genotypic variance (GV)

GV = (MSG – MSE)/r

MSG: mean square of genotypes

Heritability in the broad sense (H2)

H2 (%) = (VG/VP)*100

r: number of replicates

Genotypic Coefficient of Variation (GCV)

GCV (%) = (VG√/X)*100

√VG: standard deviation of genotypic variance

Phenotypic Coefficient of Variation (PCV)

PCV (%) = (VP√/X)*100

√VP: standard deviation of phenotypic variance

Expected genetic gain (GA)

GA = H2√VP*l

I: constancy. For a selection coefficient of 5%. I = 2.06

The magnitude of genetic advance which is estimated as percentage of mean was classified as low (< 10%), moderate (10-20%) and high (> 20%) .
Broad sense heritability estimates have been classified as high (> 60%), medium (30-60%) and low (< 30%) . Using ggcorrplot of R software, Multivariate analysis highlights correlations between the traits studied.
Principal Component Analysis (PCA) and biplots using the R software (version 3.5.1) are used to describe genotypes and variables and the relationships between both . The selection of potential varieties for genetic improvement programs was performed based on the 10 quantitative parameters, namely germination rate (GR); seedling emergence time (ET); flowering time (FT); life cycle (LC); number of fruits per plant (NF); length of fruit (LF); diameter of fruit (DF); weight of fruit (WF) of mature fruits; shape (SS); and the weight of one hundred seeds (WS).
3. Results
3.1. Phenotypic Variability
3.1.1. Plant Characteristics
The results of the plant characterization (Table 2) showed that Kaolack performed best for four variables four variables, namely GR (%), NF, SS. However, none of these variables allowed a credible discrimination of the varieties studied. Indeed, the five varieties constituted, according to the parameter characterizing the plant, two nested groups (ET) or distinct groups (two groups for GR and three for FT and LC). In these various classifications, Koloss and Charleston Gray always belonged to the same group.
3.1.2. Fruit Characteristics
None of the varieties studied accumulated the best performances for the four parameters related to the characteristics of the fruit (Table 2). Three of the variables (LF, DF and WF) analyzed clearly distinguished four of the five varieties studied, and the two varieties that exhibited the same performance varied for each of the variables. Koloss and Charleston Gray belonged to the same group for NF, asto plant characteristics (Table 2).
3.1.3. Seed Characteristics
For all five varieties, the values of the L/H ratio were significantly lower than unity (Table 2). Therefore, the five watermelon varieties studied had elongated seeds. One variable, weight of one hundred seeds made it possible to perfectly discriminate the five varieties studied. For the seed shape (SS), the varieties formed two nested groups, and here again Koloss and Charleston Gray belonged to the same group (Table 2).
For plant characteristics, the germination rate of the five varieties varies from 61.11 ± 5.82 to 90.71 ± 1.12% for Sugar Baby and Kaolack. Emergence time ranges from 7.03 ± 0.87 (Kaolack) to 8.73 ±3 (Koloss), while flowering time varies from 28.27 ± 0.45 (Crimson Sweet) to 36.24 ± 0.32 (Sugar Baby) days. The data for the number of fruits (fruit count) and fruit length, diameter, and weight are shown. Kaolack has the highest number of fruits per plant (3.55 ± 0.89), followed by Crimson Sweet (3.32 ± 0.5 while Koloss presents the lowest number of fruits per plant (2.12 ± 0.27).
Table 2. Phenotypic variability in C. lanatus.

Varieties

Plant characteristics.

Fruit characteristics.

seed characteristics

GR (%)

ET (DAS)

FT (DAS)

LC (DAS)

NF

LF (cm)

DF (cm)

WF (kg)

WS (g)

SS (L/H)

Kaolack

90.71 ± 1.12a

7.03 ± 0.87b

28.27 ± 0.45c

79.57 ± 0.55c

3.55 ± 0.89a

21.05 ± 1.14b

19.43 ± 2.06c

6.03 ± 0.87b

5.22 ± 0.01c

0.65 ± 0.03ab

Crimson sweet

89.81 ± 3.07a

8.28 ± 0.69ab

28.79 ± 0.60c

87.64 ± 1.11b

3.32 ± 0.50a

18.39 ± 1.53c

22.04 ± 1.71b

4.70 ± 0.42c

4.60 ± 0.02e

0.67 ± 0.02a

Sugar baby

61.11 ± 5.82b

8.63 ± 0.28a

36.24 ± 0.32a

110.71 ± 1.40a

2.13 ± 0.53b

13.48 ± 0.55d

16.14 ± 0.48d

3.27 ± 0.26d

4.64 ± 0.01d

0.61 ± 0.01b

Koloss

67.59 ± 8.18b

8.73 ± 1.03a

30.11 ± 0.35b

87.09 ± 0.55b

2.12 ± 0.27b

15.52 ± 0.69d

25.02 ± 1.50a

4.36 ± 0.33c

5.39 ± 0.01b

0.66 ± 0.04a

Charleston gray

69.44 ± 2.36b

8.11 ± 0.39ab

30.01 ± 0.54b

85.96 ± 1.84b

2.24 ± 0.16b

29.54 ± 2.24a

18.12 ± 0.88d

8.94 ± 0.40a

7.36 ± 0.03a

0.64 ± 0.02ab

Means in column followed by common letters are not significantly different at the 5% threshold. GR: Germination rate; ET: seedling emergence time; FT: flowering time and LC life cycle; Number of fruits per plant (NF); LF: length, DF: diameter and WF: weight of mature fruits; SS: shape seed data and WS: weight of one hundred seeds.
3.2. Correlations Between the Agro-morphological Traits
The results show that there are correlations between all the traits studied. Of the 45 correlations performed, 26 were negative and 19 were positive. All negative correlations were not significant at the 5% level, while 5 positive correlations were (Figure 2). This result shows that LF is correlated with WF (0.99) and WS (0.88). Moreover, the correlation between these two fruit characteristics (WF and LF) appeared strong and positive (0.92). Another strong and positive correlation was also observed between FT and LC (0.98). It should be noted that NF is positively correlated to no yield component GR (0.98).
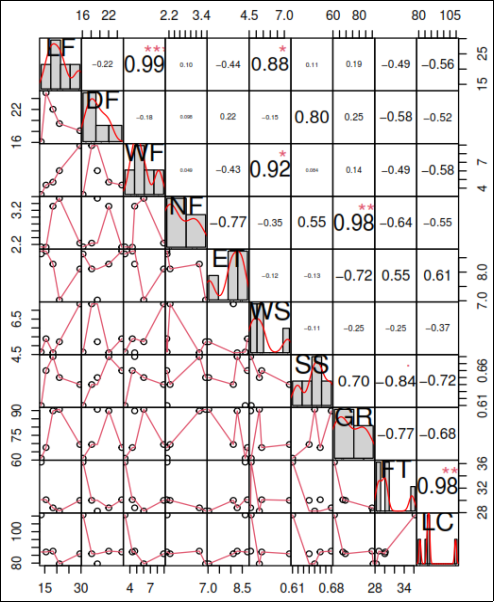
Figure 2. Correlation coefficients (r) between the agro-morphological parameters.
**: correlation is significant at the 1% threshold; *: correlation is significant at the 5% threshold. LF: length of fruit; DF: diameter of fruit, WF: weight of fruit; NF: number of fruits/plant; ET: emergence time, WS: weight of 100 seeds; SS: shape of seed; GR: germination rate; FT: flowering time; LC: life cycle.
3.3. Genetic Parameters
The phenotypic coefficient of variation ranged from 20.35 to 201.49 for the SS and WF, respectively, while the genotypic coefficient of variation ranged from 17.72 to 198.65, respectively. All the traits studied showed that the phenotypic variance was higher than the genotypic variance (Table 3).
Broad-sense heritability values ranged from 0.76% (SS) to 100 (WS) (Table 3). The values of the genetic advance varied between 0.21 (SS) and 63.48 (LF). In this study, strong broad-sense heritability and genetic advance values were recorded for LF (63.48), DF (34.04), WF (22.04), and FT (32.7). High broad-sense heritability coupled with moderate-high genetic advance was recorded for WS (11.63). High broad-sense heritability associated with low genetic advance values was obtained for SS (0.21), ET (5.89), and NF (6.43).
Table 3. Genetic parameters of characters.

Genetic Parameters

LF

DF

WF

NF

ET

WS

SS

GR

FT

Maximum

36,5

34

13,1

7

13

7,4

0,87

94,44

40

Minimum

8,5

8,7

1,2

0

5

4,54

0,44

55,55

24

Overall mean

19,6

20,15

5,46

2,67

8,15

5,44

0,64

75,73

30,68

Mean standard error

2,64

2,65

1,06

0,84

1,01

0,1

0,04

2,74

1,09

Environmental variance

20,95

21,11

3,39

2,15

3,04

0,001

0,001

22,45

3,59

Genotypic variance

970,23

292,8

117,77

11,57

10,53

31,86

0,001

4632,93

225,65

Phenotypic variance

991,18

313,92

121,16

13,72

13,57

31,86

0,017

4655,38

259,24

Environmental coefficient of variation

23,35

22,8

33,72

54,9

21,36

0,41

10

6,26

6,17

genotypic Coefficient of variation

158,92

81,91

198,65

127,31

39,8

103,74

17,72

89,88

52,11

Phenotypic coefficient of variation

160,62

87,92

201,49

138,65

45,18

103,74

20,35

90,09

52,47

Heritability (in the broad sense)

0,98

0,93

0,97

0,84

0,78

1

0,76

0,99

0,99

Genetic progress

63,48

34,04

22,04

6,43

5,89

11,63

0,21

139,88

32,7

3.4. Principal Component Analysis and Hierarchical Ascending Classification
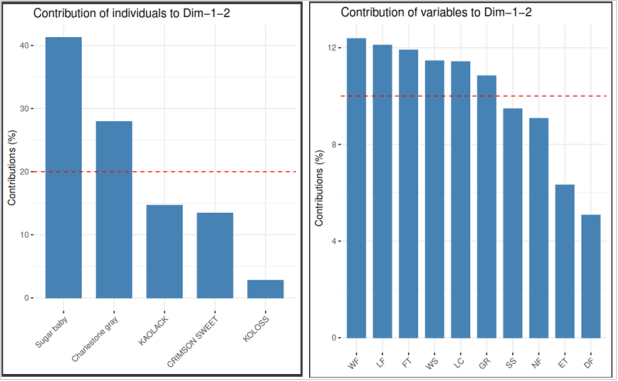
Figure 3. Contribution of the parameters and varieties to the construction of axes 1 and 2.
Only the first two axes of the principal component analysis were considered, as they accounted for approximately 92.31% of the total variation observed among the varieties (Figure 3). The contribution of the quantitative parameters to the construction of the two axes as well as varieties is shown in Figure 3. The main parameters associated with these two axes were WF, LF, FT, WS, and LC (Figure 3). Axis 1, which contains 72.62%, was associated with parameters such as FT, LC, GR, SS, and NF (Figure 3), and axis 2, which contains 17.69%, was associated with variables such as WS, WF, and LC (Figure 3).
Based on the variation, 5 genotypes were grouped into three classes using by the K-means classification (Figure 4). This enabled the genotypes to be grouped into three main classes. The first class is made up of Sugar baby variety. The second class includes Crimson sweet and Kaolack. Koloss and Charlestone gray genotypes are in the third and four groups respectively.
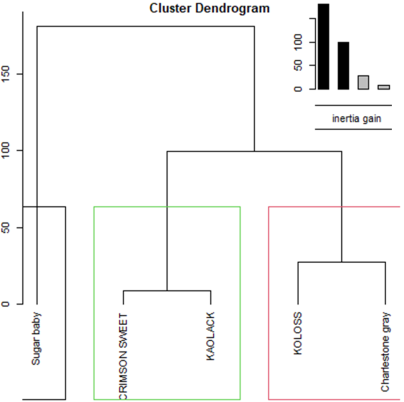
Figure 4. Grouping of five watermelons divided into three clusters based on ten agro-morphological characters.
4. Discussion
The analysis of variance (ANOVA) showed that all measured morphological parameters vary significantly (p < 0.001) between the studied watermelon cultivars. The results attained in this study show that the five watermelon varieties differed in some of the evaluated agronomic traits, like plant characteristics, four fruit traits, and seed. This result showed significant variation for the studied characters, indicating the presence of sufficient variability in the material, as the one obtained in Tunisia and India . Analysis of fruit characteristics also revealed a high degree of variation, particularly in size, shape, and color traits, suggesting a rich genetic diversity within the examined genotypes compared to . The large similarity between the genotypes indicates that these genotypes have a close relationship . There were high variations among the evaluated accessions by phenotypic traits, which were more obvious in the case of fruit and seed characteristics . According to , values for fruit width were higher for Koloss than for Lagone and Charleston Gray, while fruit length and fruit weight of the three varieties indicated similar values. Very low and very high weights of fruits were not found . This diversity is crucial for breeding programs aimed at improving specific traits, as it provides a larger pool of characteristics from which to select. According to , lack of genetic variations and slow improvement in fruit yield are common in watermelon breeding. Variability in watermelon fruit size is influenced by a combination of genetic, environmental, and management factors. On the contrary, results of both qualitative and quantitative measurements indicated that accessions of the two countries show many similarities and therefore cannot be separated clearly . Understanding these contributors is essential for breeders and growers aiming to optimize fruit size for market preferences.
Fruit weight (FW) is likely correlated with the dimensions of the fruit (such as length and width), and this would show as red squares where FW intersects with size-related variables. The shape in longitudinal section (FLS), depression at base (FDB), and shape of apical part (FAS) may show correlations with each other, indicating that certain shapes are commonly associated with specific features at the fruit's base or apex. Ground color of the skin (FGC) and main color of the flesh (FC) may or may not be correlated depending on whether there’s a common pigmentation pattern in the species studied . The highest significant correlation was observed between fruit weight (FW), fruit length (FL), and fruit width (r = 0.87), while the lowest positive correlation (r = 0.0008) was recorded between fruit length (FL) and main stem .
Fruit weight recorded a significant positive association with the traits of vine length, number of primary branches, and number of secondary branches, days to fruit maturity, fruit length, fruit diameter, seediness, and pericarp thickness. Positively correlated characters indicate that an increase in the value of a character will be followed by an increase in the value of other characters, while negatively correlated characters indicate that a decrease will follow an increase in the value of another character in the value of other characters. Fruit weight was significantly positively correlated with fruit diameter, epidermal thickness, and number of seeds . The use of genotypes with large fruit diameter, thick skin, and a large number of seeds is a breeding approach for increasing fruit weight. The observed variability and correlations between traits offer a resource for future research aiming to understand the underlying genetic basis of these morphological differences and their potential exploitation in the development of new varieties with desired characteristics.
The estimates of variance, phenotypic coefficient of variation (PCV), genotypic coefficient of variance (GCV), heritability (broad sense), and genetic advance as percent mean are presented in Table 2. The wide range of genotypic and phenotypic variation was observed for vine length (cm) (61.9 and 63.3), followed by fruit length (12.8 and 14.9), fruit girth (6.8 and 15.3), and average fruit weight (5.5 and 5.7), indicating that there is sufficient variability among the genotypes that are used for selecting desirable characters .
All parameters except WS showed genotypic variance greater than environmental variance. These findings are different from those of , who find that the environmental variance was higher than the genetic variance. The highest genotypic (198.65) and phenotypic (201.49) coefficients of variation were obtained for the WF. This highest value indicates a high potential for effective selection . Estimated heritability values ranged from 0.79 (SS) to 1.0 (WS). High heritability and high genetic gain were observed for LF, DF, WF, ET, and GR. Traits with high genetic gain and heritability imply that selection for these traits gives a good response. Indeed, this result also suggests that there may be an additive action of genes, and the selection would be favorable for improving these traits with a simple selection method. According to , selection efficiency is achieved more quickly for traits with high heritability and genetic gain. The high broad-sense heritability and moderate genetic advance were obtained for WS. The high and moderate broad-sense heritability revealed that those characters were less influenced by environmental fluctuations. These traits could be exploited through manifestation of dominance and epistatic components through hybridization followed by selection. Selection for these traits might lead to the accumulation of more desirable genotypes, and satisfactory progress could be achieved by individual selection on these characters. The high broad-sense heritability and low genetic advance were obtained for NF, ET, and SS. Low broad-sense heritability was obtained for weight of 100 seeds per fruit (16%) and number of days from planting to fruit maturity . The heritability of fruit weight was low to intermediate. The narrow-sense heritability was larger than the broad-sense heritability, although the additive variance estimates were not consistent among families . High heritability coupled with high genetic advance was observed in seed size, average fruit weight, total soluble sugar, vine length, and first female flower node. This indicated that these characters are governed by additive gene action and real progress in improvement through selection. High heritability coupled with moderate genetic advancement in fruit length and fruit diameter. Moderate to low heritability association with low genetic advancement was noticed in fruit yield and fruit girth. This indicated that the character is highly influenced by environmental effects, and selection would be ineffective for traits .
Principal component analysis (PCA) of morphological characters was used in detail to discriminate melon accessions, as in . This approach not only enhances breeding efficiency but also contributes to sustainable agricultural practices by maintaining genetic diversity within crop species. The first two dimensions expressed about 92.31% of the variation observed in the varieties. This result is different from those of , who finds 66.1% for dimensions 1 and 2. The results obtained in this study are also better than those reported by , who found 67% for the first three dimensions. The first three axes of the PCA explained 67.85% of the total morphological variability in . In this way, our PCA1 and PCA2 were mostly constructed from WF, LF, FT, WS, and LC, which can be used to discriminate our varieties. The first principal component explained 14.627% of the total variance and had a high positive relationship with fruit weight, fruit length and width, mesocarp and pericarp thickness, fruit circumference, and fruit shape . Seed attributes such as length, width, thickness, and weight loaded in the second factor and described 12.809% of the total variance . According to , principal component analysis showed that physicochemical and biochemical parameters could also potentially discriminate collections. Determination of genotypes that will be used as parents in the assembly of watermelon varieties in this research was based on the dendrogram results of morphological characters, assessment of quantitative characters, analysis of genetic parameters, and correlations between quantitative characters . Cluster analysis is a powerful statistical tool used to group watermelon genotypes based on their agromorphological traits, allowing for the identification of genetic diversity and selection of desirable characteristics for breeding programs. Hierarchical clustering analysis grouped the watermelon genotypes into distinct clusters based on their morphological traits. For instance, three main genotype clusters were identified, suggesting clear distinctions based on traits. This helps in understanding the genetic relationships among different watermelon varieties. The distribution of varieties in a separate cluster could also indicate distinct selective breeding practices that have influenced their morphological traits. Regarding hierarchical clustering analysis , genotypes were grouped into two main clusters, and all three commercial varieties were placed in the same cluster as compared with the result of this study. Cluster analysis of phenotypic traits also divided the studied accessions into two distinct groups . A previous study showed that the watermelon accessions were divided into four main clusters , whereas in this study they were divided into three groups. For enhanced production of watermelon, Koloss is recommended to farmers in the Nsukka agro-environment and similar climate-soil zones in the savanna .
5. Conclusions
Through this study, distinctive characteristics of five watermelon varieties grown in Cameroon were examined. The experimental approach followed made it possible to establish and appreciate without ambiguity some of their agro-morphological performances. The one-way analysis of variance (ANOVA) showed that all measured morphological parameters vary significantly (p/0.05) between the studied watermelon cultivars. The estimates of variance, phenotypic coefficient of variation (PCV), genotypic coefficient of variance (GCV), heritability (broad sense), and genetic advance as percent mean are presented. PCA1 and PCA2 were mostly constructed from WF, LF, FT, WS, and LC, which can be used to discriminate our varieties. Since we present detailed morphological background information for those local genotypes, our further goal is to understand their resistance to biotic/abiotic stressors and combining abilities for gene pyramiding studies. Agro- morphological traits considered in this study showed a large variability in six local melon varieties. Results obtained could be used to establish a catalogue of local melon varieties.
Abbreviations

PCV

Phenotypic Coefficient of Variation

GCV

Genotypic Coefficient of Variance

PCA

Principal Component Analysis

LSD

Least Significant Difference

Acknowledgments
We would like to express our sincere appreciation to all those who contributed to this research project. Special thanks to Emeritus Professor Joseph Bell Martin for his valuable insights and support throughout this study.
Author Contributions
Fokam Paul Ernest: Conceptualization, Investigation
Likeng-Li-Ngue Benoit-Constant: Writing – original draft, Supervision, Formal Analysis
Ndiang Zenabou: Formal Analysis, Writing – review
Ntsomboh Ntsefong Godswill: Writing – review & editing
Mafouasson Apala Hortense Noëlle: Project administration
Molo Nathalie: Writing – review & editing
Bell Joseph Martin: Supervision, Validation
Ngalle Hermine Bille: Supervision, Validation, Formal Analysis
Funding
This study was conducted without financial support from any public, commercial, or private funding agency.
Conflicts of Interest
The authors declare no conflicts of interest.
References
[1] Biswas, R., Ghosal, S., Chattopadhyay, A. and Datta, S. (2018) A Comprehensive Review on Watermelon Seed Oil – an Underutilized Product. IOSR Journal Of Pharmacy, 7, 01–07.
[2] Boualem, A., Lemhemdi, A., Sari, M.-A., Pignoly, S., Troadec, C., Choucha, F. A., Solmaz, I., Sari, N., Dogimont, C. and Bendahmane, A. (2016) The Andromonoecious Sex Determination Gene Predates the Separation of Cucumis and Citrullus Genera. PLOS ONE, Public Library of Science, 11, e0155444.
[3] Bahari, M., Rafii, M. Y., Saleh, G. B. and Latif, M. A. (2012) Combining Ability Analysis in Complete Diallel Cross of Watermelon (Citrullus Lanatus (Thunb.) Matsum. & Nakai). The Scientific World Journal, 2012, 543158.
[4] Falade, O. S., Otemuyiwa, I. O., Adekunle, A. S., Adewusi, S. A. and Oluwasefunmi, O. (2020) Nutrient Composition of Watermelon (Citrullis Lanatus (Thunb.) Matsum.&Nakai) and Egusi Melon (Citrullus Colocynthis (L.) Schrad.) Seeds. Agriculturae Conspectus Scientificus, 85, 43–49.
[5] Achiri, T. D., Konje, C. N., Nkuh, A. A. and Nsobinenyui, D. (2019) Comparative Studies on Watermelon Production in the North West and South West Regions of Cameroon: A Rural and a Peri- Urban Experience. IOSR Journal of Agriculture and Veterinary Science, 12, 55–68.
[6] Ghauri, A. O., Farrukh, U., Fatima, N., Khalid, S., Kamal, S. and Azhar, I. (2023) A Mini Review of Phytoconstituents and Pharmacological Activities of Citrullus Lanatus (Thunb.). International Journal of Natural Medicine and Health Sciences, 2, 7–11.
[7] Akintunde, O. G. and Thomas, F. C. (2021) Review of Studies Published on the Medicinal Importance of Different Parts of Citrullus Lanatus in the Last Ten Years. Biological Research, 19, 1372–1387.
[8] Nnenne, S. K., Ubaoji, K. I., Ogbodo, U. C., Enemor, V. H. A. and Oladejo, A. A. (2020) Comparative Study on the Nutritional and Antioxidant Components of Fruit Parts of Citrullus Lanatus. European Journal of Nutrition & Food Safety, Sciencedomain International, 12, 39–51.
[9] Davis, A., Webber, C., Perkins, P., Russo, V., Galarza, S. and Sakata, Y. (2008) A Review of Production Systems on Watermelon Quality 1.
[10] Tester, M. and Langridge, P. (2010) Breeding Technologies to Increase Crop Production in a Changing World. Science, 327, 818–822.
[11] Agah, L. J., Ankrumah, E. S., Ukatu, P. O., Ittah, M. A. and David, G. S. (2021) Genetic Performance of Some Watermelon [Citrullus Lanatus (Thumb.) Mastum and Nakai] Genotypes in Humid Tropical Agro-Ecology. International Journal of Plant & Soil Science, 33, 141–148.
[12] Bi, I. A. Z., Koffi, K. K. and Djè, Y. (2003) Caractérisation botanique et agronomique de trois espèces de cucurbites consommées en sauce en Afrique de l’Ouest : Citrullus sp., Cucumeropsis mannii Naudin et Lagenaria siceraria (Molina) Standl. Biotechnology, Agronomy, Society and Environment, 7, 189–199.
[13] Oraegbunam, C. J., Njoku, O. M., Imoh, O. N., Obalum, S. E., Onyia, V. N., Atugwu, A. I. and Uchida, Y. (2016) Agronomic Performance and Adaptability of Three Varieties of Watermelon (Citrullus Lanatus) on Sandy Loam Soil in Derived Savanna. Agro-Science, 15, 46–50.
[14] Siéné, L. A. C., Soko, D. F., Coulibaly, L. F., Sanoko, F. K. and Koné, M. (2018) Caractérisation agro-morphologique de cinq variétés de Cucurbitacées cultivées dans la région de Korhogo (Côte d’Ivoire). Journal of Animal & Plant Sciences, 37, 6033–6040.
[15] Hajam, M. A., Bhat, T. A., Rather, A. M., Khan, S., Reyaz, L., Hajam, M. and Paul, S. (2018) Genetic Variability, Heritability (Bs) and Genetic Advance for Various Qualitative Characters of Potato. International Journal of Chemical Studies, 6, 518–522.
[16] Tessema, G. L., Mohammed, A. W. and Abebe, D. T. (2022) Genetic Variability Studies for Tuber Yield and Yield Attributes in Ethiopian Released Potato (Solanum Tuberosum L.) Varieties. PeerJ, 10, 14.
[17] Danbe, N., Yakouba, O., Sobda, G., Basga, S. D., Lendzemo, V., Kaouvon, P., Dickmi, V. C., Suh, C., Djonnewa, A., Youri, A. and Kaboui, A. (2019) Caractérisation de la diversité phénotypique et génotypique du Sorgho pluvial dans la zone soudano sahélienne du Cameroun. Journal of Applied Biosciences, 129, 12973–12981.
[18] Ferdoush, A., Haque, M., Rashid, M. and Bari, M. (2017) Variability and Traits Association in Maize (Zea Mays L.) for Yield and Yield Associated Characters. Journal of the Bangladesh Agricultural University, 15, 193–198.
[19] Medagam, T. R., Begum, H. and Rao, N. H. (2015) Genetic Diversity and Variability in Landraces for Key Agroeconomic Traits in Vegetable Roselle (Hibiscus Sabdariffa Var. Sabdariffa L.). Jordan Journal of Biological Sciences, 8, 113–125.
[20] Singha, L. and Ullah, Z. (2020) Genetic Variability Studies for Yield and It’s Attributing Traits in Potato (Solanum Tuberosum L.). International Journal of Current Microbiology and Applied Sciences, 9, 1974–1983.
[21] Cabral Maia, M. C., Almeida, A. D. S., Borges De Araujo, L., Tadeu Dos Santos Dias, C., Cláudio De Oliveira, L., Ken Iti Yokomizo, G., Domiciano Silva Rosado, R., Damião Cruz, C., Lopes Vasconcelos, L. F., Sarmanho Da Costa Lima, P. and Macedo, L. M. (2019) Principal Component and Biplot Analysis in the Agro-Industrial Characteristics of Anacardium Spp. European Scientific Journal ESJ, 15, 21–31.
[22] Elbekkay, M., Hamza, H., Neily, M. H., Djebali, N. and Ferchichi, A. (2021) Characterization of Watermelon Local Cultivars from Southern Tunisia Using Morphological Traits and Molecular Markers. Euphytica, 217, 1–15.
[23] Jagtap, B. and Bhuktar, A. (2021) Variability Study in Watermelon (Citrullus Lanatus). International Journal of Botany Studies, 6, 788–791.
[24] Şahin, N. (2024) Morphological Characterization of Some Local Watermelon (Citrullus Lanatus L.) Genotypes of Turkey. International Journal of Life Sciences and Biotechnology, International Society of Academicians, 7, 28–36.
[25] Amzeri, A., Badami, K., Gita, P., Alfiyan Syah, Moh. and Setiadi Daryono, B. (2021) Phenotypic and Genetic Diversity of Watermelon (Citrullus Lanatus) in East Java, Indonesia. Biodiversitas Journal of Biological Diversity, 22, 5223–5230.
[26] Ebadi, M., Soltani, F., Mostofi, Y. and Alabboud, M. (2022) Analysis of Genetic Diversity among Watermelon [Citrullus Lunatus Thunb (Matsum.) and Nakai] Accessions by Phenotypic and Molecular Markers. Journal of Agriculture, Science and Technology, 24, 429–440.
[27] Szamosi, C., Solmaz, I., Sari, N. and Bársony, C. (2009) Morphological Characterization of Hungarian and Turkish Watermelon (Citrullus Lanatus (Thunb.) Matsum. et Nakai) Genetic Resources. Genetic Resources and Crop Evolution, 56, 1091–1105.
[28] Gusmini, G. and Wehner, T. C. (2007) Heritability and Genetic Variance Estimates for Fruit Weight in Watermelon. HortScience, 42, 1332–1336.
[29] Hakimi, F. (2015) Variability of Agro-Morphological Traits in Some Moroccan Watermelon Landraces (Citrullus Lanatus Thunb. Matsum. and Nakai). International Journal of Current Research, 17, 1–8.
[30] Sattar, M. A., Sultana, N., Hossain, M. M., Rashid, M. H. and Islam, A. K. M. A. (2007) GENETIC VARIABILITY, CORRELATION AND PATH ANALYSIS IN POTATO (Solanum Tuberosum L.). Bangladesh Journal of Plant Breeding and Genetics, 20, 33–38.
[31] Yildiz, M., Akgul, N. and Sensoy, S. (2014) Morphological and Molecular Characterization of Turkish Landraces of Cucumis Melo L. Notulae Botanicae Horti Agrobotanici Cluj-Napoca, 42, 51–58.
[32] Sanou, A., Konate, K., Dakuyo, R., Kabore, K., Sama, H. and Dicko, M. H. (2022) Hibiscus Sabdariffa: Genetic Variability, Seasonality and Their Impact on Nutritional and Antioxidant Properties. Islam, M. Z., Ed., PLOS ONE, 17, 1–15.
[33] Soghani, Z. N., Rahimi, M., Nasab, M. A. and Maleki, M. (2018) Grouping and Genetic Diversity of Different Watermelon Ecotypes Based on Agro-Morphological Traits and ISSR Marker. Iheringia, Série Botânica, 73, 53–59.
Cite This Article
  • APA Style

    Ernest, F. P., Benoit-Constant, L., Zenabou, N., Godswill, N. N., Noëlle, M. A. H., et al. (2026). Assessment of Genetic Variability and Character Association of Watermelon (Citrullus lanatus) varieties Using Agromorphological Characters. International Journal of Genetics and Genomics, 14(1), 14-24. https://doi.org/10.11648/j.ijgg.20261401.12

    Copy | Download

    ACS Style

    Ernest, F. P.; Benoit-Constant, L.; Zenabou, N.; Godswill, N. N.; Noëlle, M. A. H., et al. Assessment of Genetic Variability and Character Association of Watermelon (Citrullus lanatus) varieties Using Agromorphological Characters. Int. J. Genet. Genomics 2026, 14(1), 14-24. doi: 10.11648/j.ijgg.20261401.12

    Copy | Download

    AMA Style

    Ernest FP, Benoit-Constant L, Zenabou N, Godswill NN, Noëlle MAH, et al. Assessment of Genetic Variability and Character Association of Watermelon (Citrullus lanatus) varieties Using Agromorphological Characters. Int J Genet Genomics. 2026;14(1):14-24. doi: 10.11648/j.ijgg.20261401.12

    Copy | Download

  • @article{10.11648/j.ijgg.20261401.12,
      author = {Fokam Paul Ernest and Likeng-Li-Ngue Benoit-Constant and Ndiang Zenabou and Ntsomboh Ntsefong Godswill and Mafouasson Apala Hortense Noëlle and Molo Nathalie and Bell Joseph Martin and Ngalle Hermine Bille},
      title = {Assessment of Genetic Variability and Character Association of Watermelon (Citrullus lanatus) varieties Using Agromorphological Characters},
      journal = {International Journal of Genetics and Genomics},
      volume = {14},
      number = {1},
      pages = {14-24},
      doi = {10.11648/j.ijgg.20261401.12},
      url = {https://doi.org/10.11648/j.ijgg.20261401.12},
      eprint = {https://article.sciencepublishinggroup.com/pdf/10.11648.j.ijgg.20261401.12},
      abstract = {Understanding genetic diversity and germplasm classification through agro-morphological characterization is fundamental in order to provide information for genetic resources conservation and breeding programs. The overall objective of this study was to assess the genetic variability of watermelon varieties cultivated in Cameroon. Five watermelon (Citrullus lanatus) genotypes were evaluated for genetic variability, heritability, and genetic advance for yield and its contributing characters in watermelon during 2017. Analysis of variance showed significant variation for all the studied characters, indicating the presence of sufficient variability in the material. Germination rates of the five varieties vary from 61.11 ± 5.82 to 90.71 ± 1.12% for Sugar Baby and Kaolack. Emergence time ranges from 7.03 ± 0.87 (Kaolack) to 8.73 ± 1.03 (Koloss), while flowering time varies from 28.27 ± 0.45 (Crimson Sweet) to 36.24 ± 0.32 (Sugar Baby) days. The number of fruits (fruit count) show that Kaolack has the highest number of fruits per plant (3.55 ± 0.89), followed by Crimson Sweet (3.32 ± 0.5) while Koloss presents the lowest number of fruits per plant (2.12 ± 0.27). Of the 45 correlations performed, 26 were negative and 19 were positive. All negative correlations were not significant at the 5% level, while 5 positive correlations were significant. This result shows that length of fruit is correlated with weight of fruit (0.99) and weight of one hundred seeds (0.88). Moreover, the correlation between these two fruit characteristics (weight of fruit and length of fruit) appeared strong and positive (0.92). The phenotypic coefficient of variation ranged from 20.35 to 201.49 for the seed shape and weight of fruit parameters, respectively, while the genotypic coefficient of variation ranged from 17.72 to 198.65 for the same traits, respectively. All the traits studied showed that the phenotypic variance was higher than the genotypic variance. High broad-sense heritability coupled with moderate-high genetic advance was recorded for weight of one hundred seeds (11.63), while high broad-sense heritability associated with low genetic advance values was obtained for seed shape (0.21), seedling emergence time (5.89), and number of fruits per plant (6.43). Only the first two axes of the principal component analysis were taken into account because they explained about 92.31% of the variation observed in the varieties. The main parameters associated with these two axes were weight of fruit, length of fruit, flowering time, weight of one hundred seeds and life cycle. Based on the variation, 5 genotypes were grouped into three classes using the K-means classification. Further studies involving biochemical and molecular markers are recommended for deeper characterization.},
     year = {2026}
    }
    

    Copy | Download

  • TY  - JOUR
    T1  - Assessment of Genetic Variability and Character Association of Watermelon (Citrullus lanatus) varieties Using Agromorphological Characters
    AU  - Fokam Paul Ernest
    AU  - Likeng-Li-Ngue Benoit-Constant
    AU  - Ndiang Zenabou
    AU  - Ntsomboh Ntsefong Godswill
    AU  - Mafouasson Apala Hortense Noëlle
    AU  - Molo Nathalie
    AU  - Bell Joseph Martin
    AU  - Ngalle Hermine Bille
    Y1  - 2026/02/26
    PY  - 2026
    N1  - https://doi.org/10.11648/j.ijgg.20261401.12
    DO  - 10.11648/j.ijgg.20261401.12
    T2  - International Journal of Genetics and Genomics
    JF  - International Journal of Genetics and Genomics
    JO  - International Journal of Genetics and Genomics
    SP  - 14
    EP  - 24
    PB  - Science Publishing Group
    SN  - 2376-7359
    UR  - https://doi.org/10.11648/j.ijgg.20261401.12
    AB  - Understanding genetic diversity and germplasm classification through agro-morphological characterization is fundamental in order to provide information for genetic resources conservation and breeding programs. The overall objective of this study was to assess the genetic variability of watermelon varieties cultivated in Cameroon. Five watermelon (Citrullus lanatus) genotypes were evaluated for genetic variability, heritability, and genetic advance for yield and its contributing characters in watermelon during 2017. Analysis of variance showed significant variation for all the studied characters, indicating the presence of sufficient variability in the material. Germination rates of the five varieties vary from 61.11 ± 5.82 to 90.71 ± 1.12% for Sugar Baby and Kaolack. Emergence time ranges from 7.03 ± 0.87 (Kaolack) to 8.73 ± 1.03 (Koloss), while flowering time varies from 28.27 ± 0.45 (Crimson Sweet) to 36.24 ± 0.32 (Sugar Baby) days. The number of fruits (fruit count) show that Kaolack has the highest number of fruits per plant (3.55 ± 0.89), followed by Crimson Sweet (3.32 ± 0.5) while Koloss presents the lowest number of fruits per plant (2.12 ± 0.27). Of the 45 correlations performed, 26 were negative and 19 were positive. All negative correlations were not significant at the 5% level, while 5 positive correlations were significant. This result shows that length of fruit is correlated with weight of fruit (0.99) and weight of one hundred seeds (0.88). Moreover, the correlation between these two fruit characteristics (weight of fruit and length of fruit) appeared strong and positive (0.92). The phenotypic coefficient of variation ranged from 20.35 to 201.49 for the seed shape and weight of fruit parameters, respectively, while the genotypic coefficient of variation ranged from 17.72 to 198.65 for the same traits, respectively. All the traits studied showed that the phenotypic variance was higher than the genotypic variance. High broad-sense heritability coupled with moderate-high genetic advance was recorded for weight of one hundred seeds (11.63), while high broad-sense heritability associated with low genetic advance values was obtained for seed shape (0.21), seedling emergence time (5.89), and number of fruits per plant (6.43). Only the first two axes of the principal component analysis were taken into account because they explained about 92.31% of the variation observed in the varieties. The main parameters associated with these two axes were weight of fruit, length of fruit, flowering time, weight of one hundred seeds and life cycle. Based on the variation, 5 genotypes were grouped into three classes using the K-means classification. Further studies involving biochemical and molecular markers are recommended for deeper characterization.
    VL  - 14
    IS  - 1
    ER  - 

    Copy | Download

Author Information
  • Laboratory of Genetics and Plant Breeding, Department of Plant Biology, Faculty of Science, University of Yaoundé I, Yaoundé, Cameroon

    Research Fields: Plant biotechnologist.

  • Laboratory of Genetics and Plant Breeding, Department of Plant Biology, Faculty of Science, University of Yaoundé I, Yaoundé, Cameroon;Research and Support Centre for Agropastoral Producers in Cameroon (CRAPAC), Yaoundé, Cameroon

    Biography: Likeng-Li-Ngue Benoit-Constant (Date of birth: July 16, 1984) holds a PhD in Plant Biotechnology with a major in genetics and plant improvement (2019). He is Lecturer at the Department of Plant Biology, Faculty of Sciences (since 2020), Director of Research and Cooperation at the Higher Institute of Agriculture and Management of Obala (ISAGO, since 2019), National Coordinator of the organization of the Cameroonian Contest of Local Products (CCPT) at United Nations Industrial Development Organization (UNIDO), Coordinator of the Genetics and Plant Improvement Unit of the University of Yaoundé I (since 2014), Promoter of the Research and Support Center for Agropastoral Producers of Cameroon (CRAPAC, since 2022) Consultant to the Network of Sustainable Development Actors (RADD).

    Research Fields: Plant biotechnologist, genetic and plant improvement, plant breeding.

  • Department of Plant Biology, Faculty of Science, University of Douala, Douala, Cameroon

    Research Fields: genetic and plant improvement, plant breeding.

  • Laboratory of Genetics and Plant Breeding, Department of Plant Biology, Faculty of Science, University of Yaoundé I, Yaoundé, Cameroon

    Research Fields: biotechnologist.

  • Institute of Agricultural Research for Development, Yaoundé, Cameroon

    Research Fields: Crops improvement.

  • Laboratory of Genetics and Plant Breeding, Department of Plant Biology, Faculty of Science, University of Yaoundé I, Yaoundé, Cameroon;Research and Support Centre for Agropastoral Producers in Cameroon (CRAPAC), Yaoundé, Cameroon

    Research Fields: data analyst, plant production.

  • Laboratory of Genetics and Plant Breeding, Department of Plant Biology, Faculty of Science, University of Yaoundé I, Yaoundé, Cameroon

    Research Fields: genetic and plant improvement, plant breeding.

  • Laboratory of Genetics and Plant Breeding, Department of Plant Biology, Faculty of Science, University of Yaoundé I, Yaoundé, Cameroon

    Research Fields: genetic, genetic variability of traits.